Case Study · Content and Ecommerce SEO

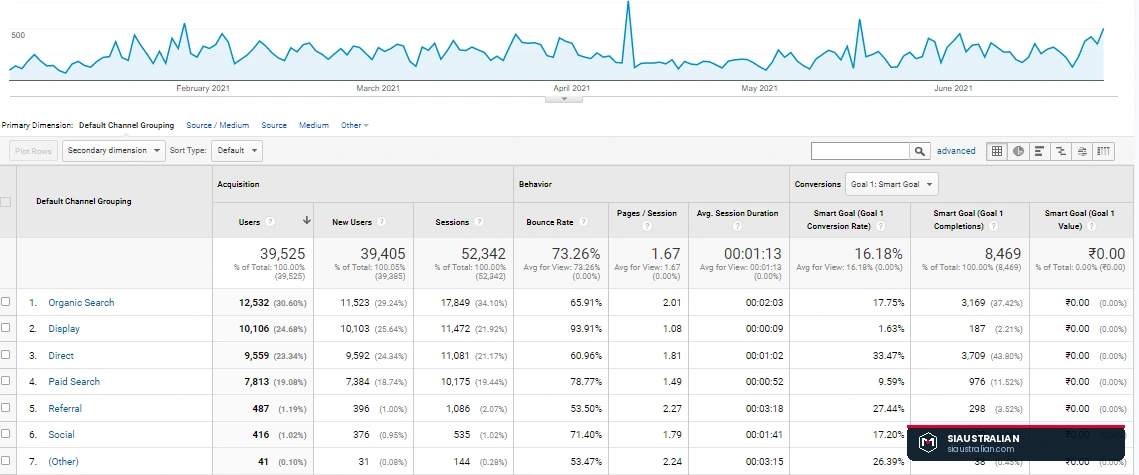
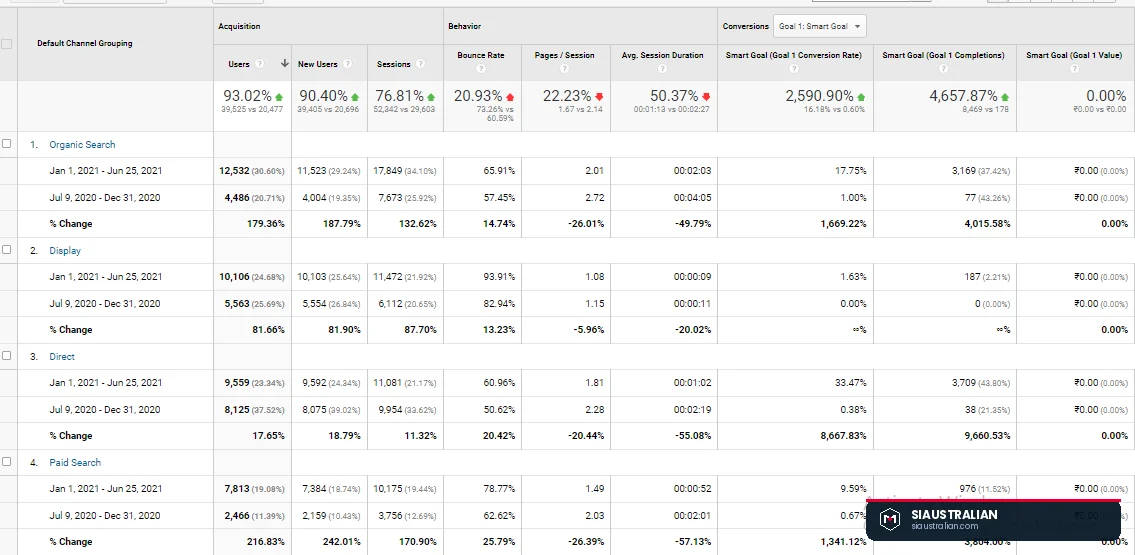
Ecommerce fulfilment platform: sessions up 76.81% in six months.

A content driven ecommerce platform with weak organic reach. Organic traffic share moved from 20.7 percent to 30.8 percent of all sessions.

India Content and Ecommerce SEO 2020 to 2021

The numbers

76.81% more sessions

Six month comparison

Organic share 20.7% to 30.8%

Of total traffic

1,500+ keywords

Improved over the period

Strong referring domains

Built from a very low base

Where the site started

Barely any visitors, no SERP exposure, and content that was published without keyword targeting or internal structure behind it.

Poor SERP visibility

The site barely appeared for the terms its buyers were searching, so almost all traffic was direct or referral.

Very low session volume

Monthly sessions were small enough that no content test could produce a readable result.

Weak referring domains

Few links, and few from sites with any authority in the niche.

Speed and Core Web Vitals

Render blocking scripts, uncompressed images and no browser caching.

Metadata missing or duplicated

Titles and descriptions repeated across pages, and absent on others entirely.

No internal link structure

Pages sat isolated, so authority never flowed from the strongest pages to the commercial ones.

The work

What we actually changed.

01

Technical repair

Deferred JavaScript, browser caching, image compression, redirect chains removed and gzip enabled.

02

On page rebuild

Keyword research, then titles, H1s, alt tags and metadata rewritten around the terms that carried commercial intent.

03

Site architecture

Internal linking restructured so authority reaches the money pages, and anchor text made descriptive.

04

Authority building

Links from relevant sites in the niche, guest posts, and a link intersect analysis against competitors.

The evidence

Screenshots from the project file.

Watermarked only. Figures are read directly from Analytics, Ahrefs and GTmetrix as they appeared at the time.

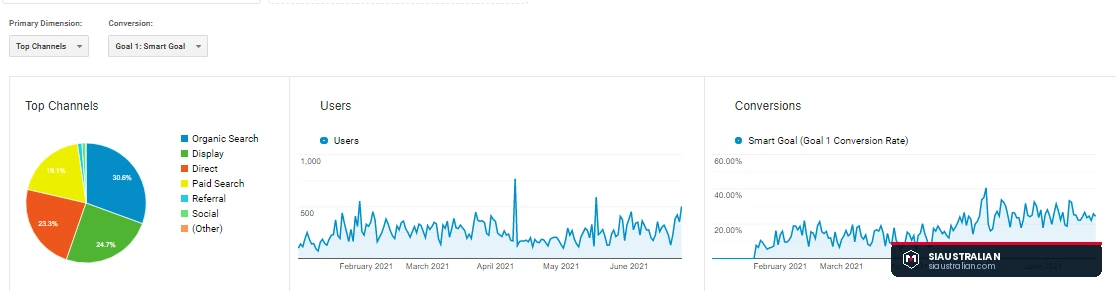
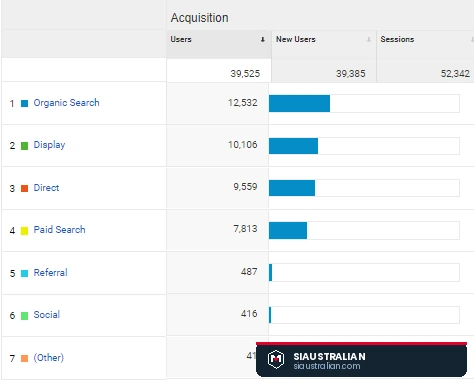
Google Analytics acquisition channels for eshopbox before the work
Traffic mix before
Google Analytics month by month comparison for eshopbox
Month on month change
Google Analytics traffic overview for eshopbox
Sessions and users over the period
Internal linking structure diagram used for the site
The internal linking structure applied
Reading this honestly

What this does and does not prove.

India, not Australia

This project was delivered for a client in India. The method is the same one we use in Australia, but the market, competitors and search behaviour were different.

2020 to 2021

Search has changed since then. Some of what worked here still works, and some of it has been replaced by newer requirements.

One site, one situation

Your starting position, competition and budget are different. This is evidence of method, not a forecast of your result.

Figures as recorded

Every number here comes from the screenshots shown above. We have not rounded up, restated or recalculated anything.
Start here

Want the same diagnosis run on your site?

Proof, not promises

Every number below has a screenshot behind it.

No invented testimonials anywhere on this site. Where results were not verified, we say so on the page.

Local SEO, Australia

Google Business Profile growth

Interactions
+48.6%
Phone calls
+80%

Two months of local SEO for an Australian local business, measured year on year.

Read the case study →
Technical SEO

Health score 1 to 85

Health score
85
Crawl errors
36

Crawl errors cleared from 58,614 to 36 in a full technical rebuild.

Read the case study →
Ecommerce SEO

Sessions 34,116 to 120,539

Sessions
120,539
Best keyword
#2

Position 2 for a commercial term at 3,700 searches a month.

Read the case study →
SI Australian Typically replies within a few hours
Hi there. Send us your website and we will tell you what is holding it back, free. No cost, no obligation
We reply to every message, usually within a few hours.